 我们与乌克兰的朋友和同事站在一起。支持乌克兰度过难关,请
 服务性能监控 (SPM)
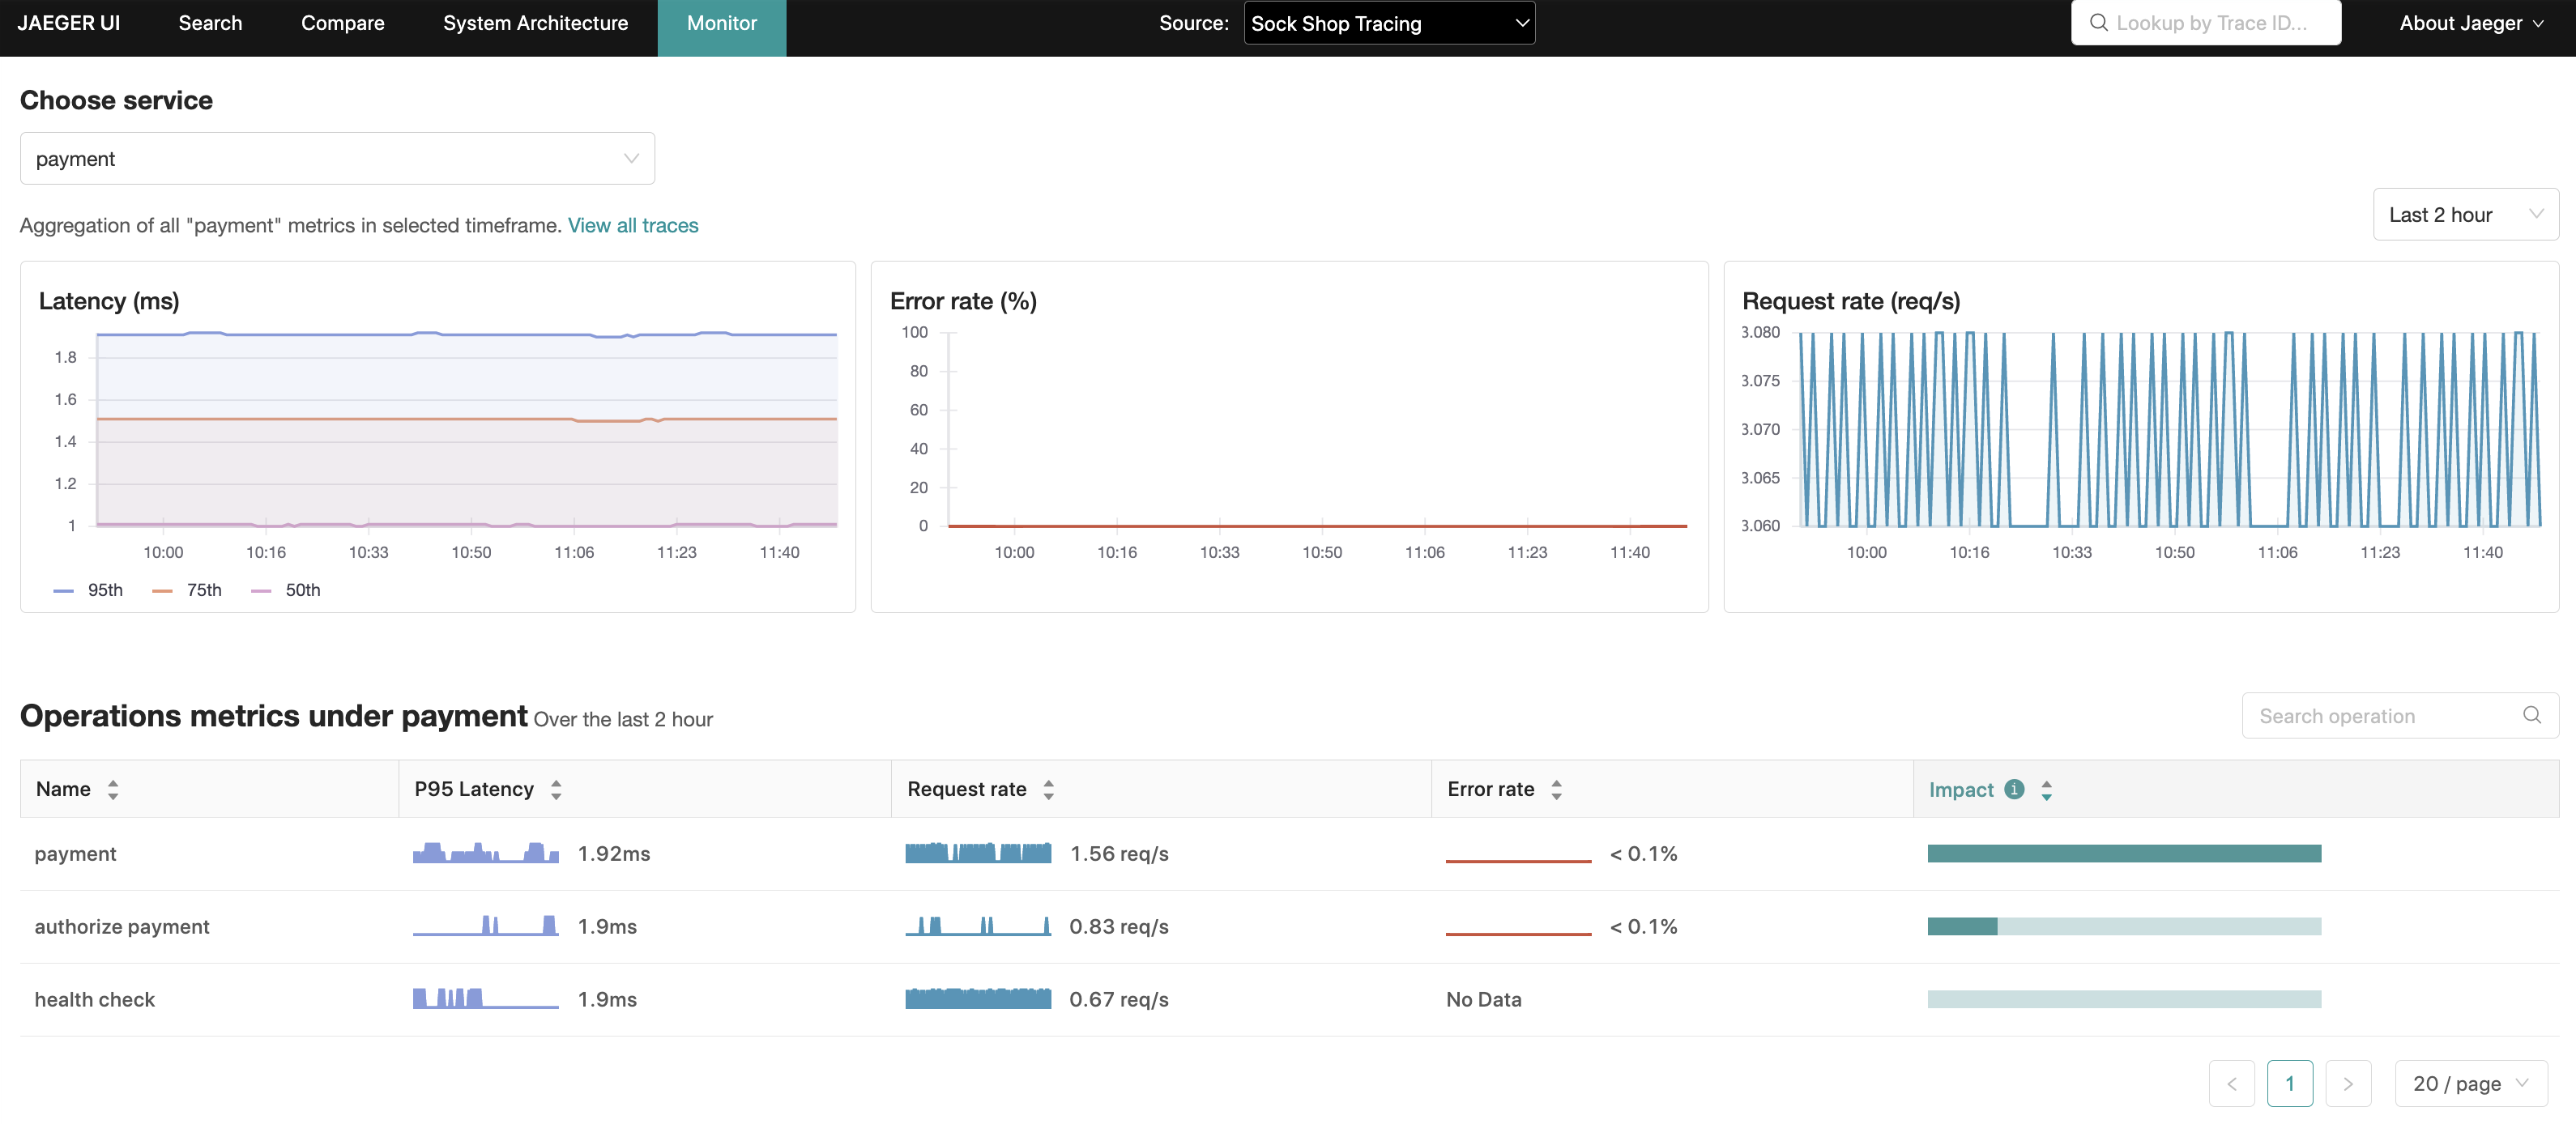
该功能在 Jaeger 用户界面中作为“Monitor”选项卡呈现,其目的是帮助识别有价值的跟踪(例如:高 QPS、慢速或错误的请求),而无需预先知道服务或操作的名称。
它主要通过聚合 span 数据来生成 RED(请求、错误、持续时间)指标来实现。
潜在用例包括
- 部署后在组织内或请求链中已知的依赖服务上进行健全性检查。
- 在出现问题告警时进行监控和根本原因分析。
- 为 Jaeger UI 新用户提供更好的入门体验。
- 对 QPS、错误和延迟进行长期趋势分析。
- 容量规划。
UI 功能概述
“监控”选项卡提供服务级别的聚合,以及服务内部的操作级别的聚合,包括请求速率、错误速率和持续时间(P95、P75 和 P50),也称为 RED 指标。
在操作级别的聚合中,一个“影响”指标(计算为延迟和请求速率的乘积)是另一个信号,可用于排除那些本身可能具有高延迟特征的操作,例如日常批处理作业,或者反过来突出显示在延迟排名中较低但具有高 RPS(每秒请求数)的操作。
通过这些聚合,Jaeger UI 能够使用相关的服务、操作和回溯期预填充追踪搜索,缩小对这些更有趣追踪的搜索范围。
开始
Jaeger 仓库 中提供了一个本地可运行的设置,以及如何运行它的说明。
可以通过顶部菜单中的“监控”选项卡访问该功能。
此演示包含 Microsim ;一个微服务模拟器,用于生成追踪数据。
如果倾向于手动生成追踪,可以通过 docker 启动示例应用程序:HotROD。请务必在 docker run 命令中包含 --net monitor_backend。
配置
config-spm.yaml 是 Jaeger 仓库中提供的一个示例配置。启用 SPM 功能需要以下步骤
- 在 pipeline 中启用 SpanMetrics 连接器
# Declare an exporter for metrics produced by the connector.
# For example, a Prometheus server may be configured to scrape
# the metrics from this endpoint.
exporters:
  prometheus:
    endpoint: "0.0.0.0:8889"

# Declare spanmetrics connector.
connectors:
  spanmetrics:
    # any connector configuration options
    ...

# Enable the spanmetrics connector to bridge
# the traces pipeline into the metrics pipeline.
service:
  pipelines:
    traces:
      receivers: [otlp]
      processors: [batch]
      exporters: [jaeger_storage_exporter, spanmetrics]
    metrics/spanmetrics:
      receivers: [spanmetrics]
      exporters: [prometheus]
- 在
jaeger_storage扩展下的metric_backends:中定义一个远程 PromQL 兼容存储
extensions:
  jaeger_storage:
    backends:
      some_trace_storage:
        ...
    metric_backends:
      some_metrics_storage:
        prometheus:
          endpoint: http://prometheus:9090
- 在
jaeger_query扩展中引用此指标存储
extensions:
  jaeger_query:
    traces: some_trace_storage
    metrics_storage: some_metrics_storage
- 在 Jaeger UI 配置中设置
monitor.menuEnabled=true属性。
架构
除了标准的 Jaeger 架构外,SPM 功能还需要以下附加组件
- 在 pipeline 中引入了一个 SpanMetrics 连接器 ,用于接收追踪数据 (spans) 并生成 RED 指标。
- 生成的指标会导出到一个 Prometheus 兼容的指标存储。在提供的示例中,这通过定义一个打开 HTTP 端点的
prometheusexporter,并配置一个 Prometheus 服务器从该端点抓取指标来实现。另一种方法是使用 push 式 exporter 将指标写入远程指标存储。 - 支持 PromQL 查询的外部指标存储。
- 在
jaeger_query扩展中的配置,用于引用外部指标存储。
指标存储
Jaeger Query 支持任何 PromQL 兼容的后端。Julius Volz 在以下文章中整理了这些后端列表:https://promlabs.com/blog/2020/11/26/an-update-on-promql-compatibility-across-vendors
派生时间序列
有必要了解 SpanMetrics 连接器 在指标存储中将生成的附加指标和时间序列,以便在部署 SPM 时帮助进行容量规划。
请参考 Prometheus 文档 中关于指标名称、类型、标签和时间序列概念的部分;这些术语将在本节的其余部分使用。
将创建两个指标名称
calls_total- 类型:计数器
- 描述:统计 span 的总数,包括错误 span。调用计数通过
status_code标签与错误区分开。任何带有status_code = "STATUS_CODE_ERROR"标签的时间序列都被识别为错误。
[namespace_]duration_[units]- 类型:直方图
- 描述:span 持续时间/延迟的直方图。在底层,Prometheus 直方图会创建多个时间序列。为了说明目的,假设未配置命名空间,单位为
毫秒duration_milliseconds_count:直方图所有 bucket 中数据点的总数。duration_milliseconds_sum:所有数据点值的总和。duration_milliseconds_bucket:每个持续时间 bucket 的n个时间序列集合(n为持续时间 bucket 的数量),由le(小于或等于)标签标识。对于每个 span,具有最低le且le >= span duration的duration_milliseconds_bucket计数器会递增。
以下公式旨在为创建的新时间序列数量提供一些指导
num_status_codes * num_span_kinds * (1 + num_latency_buckets) * num_operations

Where:
  num_status_codes = 3 max (typically 2: ok/error)
  num_span_kinds = 6 max (typically 2: client/server)
  num_latency_buckets = 17 default
假设默认配置,代入这些数字
max = 324 * num_operations
typical = 72 * num_operations
注意
- 在 spanmetrics 连接器中配置的自定义持续时间 bucket 或维度 将改变上述计算。
- SPM 不支持查询自定义维度,它们将被聚合。
API
gRPC/Protobuf
以编程方式检索 RED 指标的推荐方法是通过 metricsquery.proto IDL 文件中定义的 jaeger.api_v2.metrics.MetricsQueryService gRPC 端点。
HTTP JSON
Jaeger UI 的“监控”选项卡内部使用,用于填充其可视化所需的指标。
有关 HTTP API 的详细规范,请参阅此 README 文件 。
故障排除
检查 Jaeger-Prometheus 连接
通过检查 Jaeger 的内部遥测数据,验证 Jaeger query 能否连接到 Prometheus 兼容的指标存储。
Jaeger 配置需要在 telemetry: 部分启用指标端点。请注意,内部遥测应该暴露在与用于从 spanmetrics 连接器导出指标的端口(例如 8889)不同的端口(例如 8888)上。
service:
  ...
  telemetry:
    resource:
      service.name: jaeger
    metrics:
      level: detailed
      address: 0.0.0.0:8888
此端口上的 /metrics 端点可用于检查 UI 查询 SPM 数据是否成功。
curl -s http://jaeger:8888/metrics | grep jaeger_metricstore
以下指标最值得关注
jaeger_metricstore_requests_totaljaeger_metricstore_latency_bucket
每个指标都会有一个标签,对应以下每个操作
get_call_ratesget_error_ratesget_latenciesget_min_step_duration
如果一切按预期工作,带有 result="ok" 标签的指标应该会递增,而 result="err" 则保持不变。例如
jaeger_metricstore_requests_total{operation="get_call_rates",result="ok"} 18
jaeger_metricstore_requests_total{operation="get_error_rates",result="ok"} 18
jaeger_metricstore_requests_total{operation="get_latencies",result="ok"} 36

jaeger_metricstore_latency_bucket{operation="get_call_rates",result="ok",le="0.005"} 5
jaeger_metricstore_latency_bucket{operation="get_call_rates",result="ok",le="0.01"} 13
jaeger_metricstore_latency_bucket{operation="get_call_rates",result="ok",le="0.025"} 18

jaeger_metricstore_latency_bucket{operation="get_error_rates",result="ok",le="0.005"} 7
jaeger_metricstore_latency_bucket{operation="get_error_rates",result="ok",le="0.01"} 13
jaeger_metricstore_latency_bucket{operation="get_error_rates",result="ok",le="0.025"} 18

jaeger_metricstore_latency_bucket{operation="get_latencies",result="ok",le="0.005"} 7
jaeger_metricstore_latency_bucket{operation="get_latencies",result="ok",le="0.01"} 25
jaeger_metricstore_latency_bucket{operation="get_latencies",result="ok",le="0.025"} 36
如果从 Prometheus 读取指标时出现问题,例如无法连接到 Prometheus 服务器,那么带有 result="err" 的指标会递增。例如
jaeger_metricstore_requests_total{operation="get_call_rates",result="err"} 4
jaeger_metricstore_requests_total{operation="get_error_rates",result="err"} 4
jaeger_metricstore_requests_total{operation="get_latencies",result="err"} 8
此时,检查日志将提供更多深入信息,帮助找出问题的根本原因。
查询 Prometheus
即使上述 Jaeger 指标显示从 Prometheus 读取成功,图表仍然可能显示为空。在这种情况下,直接在 Prometheus 上查询 spanmetrics 连接器应生成的任何指标。
traces_span_metrics_duration_milliseconds_buckettraces_span_metrics_calls_total
当 Jaeger 接收到追踪时,您应该会看到这些计数器在增加。
检查日志
如果上述指标存在于 Prometheus 中,但未显示在“监控”选项卡中,这意味着 Jaeger 期望在 Prometheus 中看到的指标与实际可用的指标之间存在差异。
这可以通过增加日志级别来确认
service:
  telemetry:
    ...
    logs:
      level: debug
输出类似于以下的日志(已格式化以便阅读)
2024-11-26T19:09:43.152Z debug metricsstore/reader.go:258 Prometheus query results
{
  "kind": "extension",
  "name": "jaeger_storage",
  "results": "",
  "query": "sum(rate(traces_span_metrics_calls_total{service_name =~ \"redis\", span_kind =~ \"SPAN_KIND_SERVER\"}[10m])) by (service_name,span_name)",
  "range": {
    "Start": "2024-11-26T19:04:43.14Z",
    "End": "2024-11-26T19:09:43.14Z",
    "Step": 60000000000
  }
}
在此情况下,假设 OpenTelemetry Collector 的 prometheusexporter 引入了一个破坏性更改,它在计数器指标和直方图指标(例如 duration_milliseconds_bucket)的持续时间单位上附加了 _total 后缀。正如我们发现的,Jaeger 正在寻找 calls(和 duration_bucket)指标名称,而 OpenTelemetry Collector 写入的是 calls_total(和 duration_milliseconds_bucket)。
在这种特定情况下,解决方案是向指标后端配置传递参数,告知 Jaeger 规范化指标名称,使其知道应该搜索 calls_total 和 duration_milliseconds_bucket,如下所示
extensions:
  jaeger_storage:
    backends:
      ...
    metric_backends:
      some_metrics_storage:
        prometheus:
          endpoint: http://prometheus:9090
          normalize_calls: true
          normalize_duration: true
检查 OpenTelemetry Collector 配置
如果错误 span 出现在 Jaeger 中,但没有相应的错误指标
- 检查 spanmetrics 连接器在 Prometheus 中生成的原始指标(如上所列:
calls、calls_total、duration_bucket等)是否包含 span 应属于的指标中的status.code标签。 - 如果没有
status.code标签,请检查 OpenTelemetry Collector 配置文件,特别是是否存在以下配置Jaeger 使用此标签来确定请求是否包含错误。exclude_dimensions: ['status.code']
检查 OpenTelemetry Collector
如果上述 latency_bucket 和 calls_total 指标为空,则可能是 OpenTelemetry Collector 或其上游的任何组件配置错误。
排查问题时可以问以下问题
- OpenTelemetry Collector 配置是否正确?
- OpenTelemetry Collector 是否能访问到 Prometheus 服务器?
- 服务是否正在向 OpenTelemetry Collector 发送 spans?
服务/操作在“监控”选项卡中缺失
如果服务/操作在“监控”选项卡中缺失,但在 Jaeger 追踪搜索服务和操作下拉菜单中可见,常见原因是指标查询中使用了默认的 server span kind。
您看不到的服务/操作可能来自于非 server span kind 的 spans,例如 client 或更糟糕的 unspecified。因此,这是一个 instrumentation 数据质量问题,应该在 instrumentation 中设置 span kind。
默认使用 server span kind 的原因是为了避免分别在 server 和 client span kind 中对 ingress 和 egress spans 进行重复计数。
执行指标查询时出现 403 错误
如果日志包含类似错误:failed executing metrics query: client_error: client error: 403,则可能是 Prometheus 服务器需要 bearer token。
Jaeger 可以配置为在指标查询中传递 bearer token。可以通过 token_file_path: 属性定义 token。
extensions:
  jaeger_storage:
    backends:
      ...
    metric_backends:
      some_metrics_storage:
        prometheus:
          endpoint: http://prometheus:9090
          token_file_path: /path/to/token/file
          token_override_from_context: true